

The uneven journey of wholesale gas and electricity prices to consumer bills
Prepared by Friderike Kuik, Eliza Lis and Johannes Schäfer
The sharp rise in energy prices in the first half of 2026 evoked memories of the 2021-22 energy price shock, but the nature of the shock in 2026 is different in several ways. So far, the 2026 energy price shock has been smaller in scale, with more limited increases in wholesale gas and electricity prices than during the last energy crisis (Chart A).[1] The impact of wholesale gas prices on wholesale electricity prices – which is typically strong with gas prices being the marginal price-setter for electricity prices – was dampened by a shift towards electricity generated from renewables. In addition, the way in which wholesale gas and electricity prices pass through to retail prices has evolved. This box examines how changes in wholesale gas prices are transmitted to consumers, focusing on their impact on wholesale electricity prices as well as retail price-setting for gas and electricity.[2]
Chart A
Total energy cost index for the euro area
(index)

Sources: LSEG Eurostat and ECB calculations.
Notes: Wholesale gas prices refer to the Dutch TTF gas prices. Crude oil prices (in EUR/barrel), wholesale gas prices (in EUR/MWh) and wholesale electricity prices (in EUR/MWh) are indexed to August 2021 = 100 and January 2026 = 100, and then aggregated. Aggregation weights for the total energy cost index are based on the respective contribution of oil, gas and electricity to EU final energy consumption, based on data up to and including 2024 and held fixed thereafter. The latest observations are for August 2026.
Pressures on electricity prices have been lower in 2026 compared with 2021-22, in part owing to higher shares of electricity generated from renewables. In 2021-22 droughts reduced hydropower generation and a large number of French nuclear power plants were under maintenance. This led to a high reliance on gas for electricity generation across Europe at a time when gas supplies were severely reduced following the outbreak of the war in Ukraine (Chart B, panel a).[3] So far in 2026, gas market pressures have been comparably lower.[4] Furthermore, many countries have increased their low-carbon electricity generation, particularly through renewables (Chart B, panel a). As a result, wholesale electricity prices have increased more modestly in 2026 compared with 2021-22. They have also diverged across European markets since the 2021-22 energy price shock (Chart B, panel b).
Chart B
Aggregate electricity generation and wholesale electricity prices in euro area countries
a) Electricity generation |
b) Wholesale electricity prices |
|---|---|
(TWh) |
(EUR/MWh) |
 |
 |
Sources: European Network of Transmission System Operators for Electricity, LSEG and ECB calculations.
Notes: In panel a), the data are based on a 365-day centred moving average of the sum of daily electricity generation in Germany, Spain, France and Italy. “Other” comprises electricity generated from various smaller sources, including biomass, geothermal energy, other renewables, oil, oil shale, peat and waste. In panel b), the data are based on monthly averages. The latest observations are for 20 August 2026 for panel a) and August 2026 for panel b).
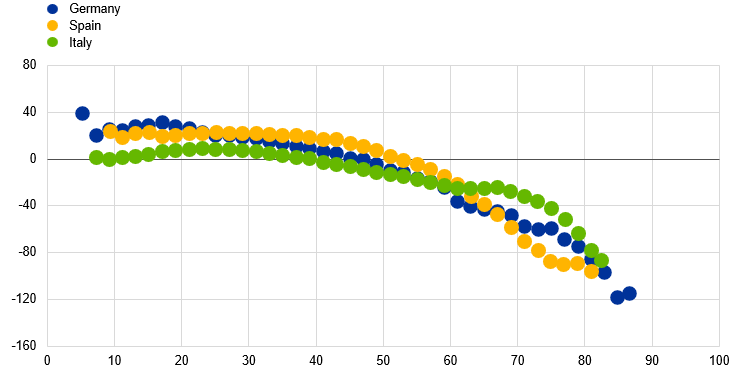
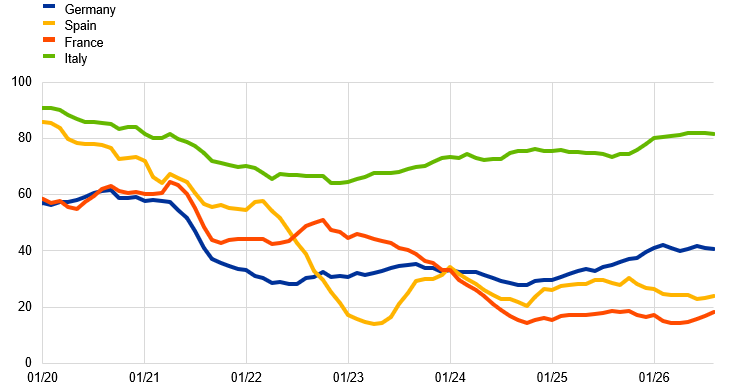
The effect of rising shares of electricity generated from renewables on wholesale electricity prices is negative, non-linear and uneven across countries (Chart C). At the same time, there are substantial cross-country differences in renewable electricity capacity and generation.[5] Together, these factors can cause uneven price developments. In Spain, where the share of electricity generated from renewables is highest, the number of hours in which electricity prices are set by gas prices is consistently lower and has decreased substantially over the years (Chart D). Similar developments are seen in France, where nuclear power often dominates the electricity mix and price-setting. By contrast, in Italy, electricity prices are still frequently determined by gas prices.
Chart C
Wholesale electricity prices and renewable electricity generation
(x-axis: percentage share of renewable electricity generation, y-axis: percentage deviation from price expected)
Sources: European Network of Transmission System Operators for Electricity, LSEG and ECB calculations.
Notes: Based on Quintana (2024), day-ahead wholesale electricity prices are regressed on natural gas and EU Emissions Trading System allowance prices. The regression residuals capture the deviation from the price expected with gas as the marginal price-setter, primarily reflecting the role of technologies other than gas as the marginal price-setter. Residuals are aggregated within 2 percentage point-wide bins of the corresponding renewable share. France is excluded given the outsized role of nuclear power in terms of both the share of electricity generation and price-setting. The data are from 2015 onwards. The latest observations are for July 2026. The data for June 2022 to February 2023 are excluded for Spain because the “Iberian exception” was in place, a policy measure decoupling wholesale electricity prices from gas prices.
Chart D
Hours in which gas sets the price of electricity
(average percentage share of hours within a month, 12 months centred moving average)
Sources: European Network of Transmission System Operators for Electricity, LSEG and ECB calculations.
Notes: The electricity price in a given hour is classified as gas price-setting if the hourly wholesale electricity price is equal to or greater than the short-run marginal cost of gas-fired electricity. This cost of gas-fired electricity is calculated from the daily wholesale gas price and the daily EU Emissions Trading System price, assuming 2 MWh of gas input per 1 MWh of electricity output and an emission factor of 0.4 tons of CO2 per MWh of electricity produced with gas. The latest observations are for August 2026.
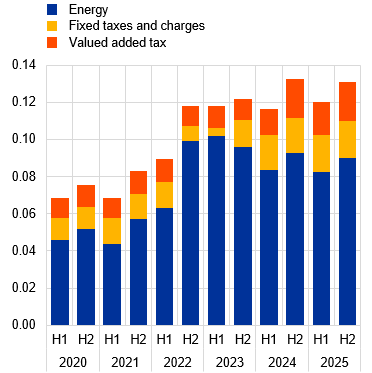
The pass-through of wholesale gas and wholesale electricity prices to gas and electricity inflation, as measured by the Harmonised Index of Consumer Prices (HICP), depends on retail price-setting mechanisms and price composition. Retail prices can be regulated or market-based and can be adjusted flexibly or at fixed intervals in both sectors. The pass-through rate is fastest when prices are market-based and flexibly adjusted. Relatively slow-moving taxes and charges dampen the transmission of wholesale energy price changes to HICP gas and electricity inflation. In 2025 taxes and charges accounted for 31% of gas prices and 27% of electricity prices, on average, in the euro area (Chart E).[6] The strength of pass-through can also depend on the duration of the energy price spike. For example, in countries where energy providers buy electricity and gas years in advance on the futures market and offer longer-term contracts to their customers, a short-lived spike in wholesale prices may only have a limited impact on consumers.
Chart E
Retail price composition in the euro area
a) Gas |
b) Electricity |
|---|---|
(EUR/kWh) |
(EUR/kWh) |
 |
 |
Sources: Eurostat and ECB calculations.
Notes: The retail prices shown apply to consumers who fall within the median consumption bands of 20-199 GJ for gas and 2000-4999 kWh for electricity. Aggregated data for euro area countries are based on HICP weights using each country’s contribution to euro area gas and electricity.
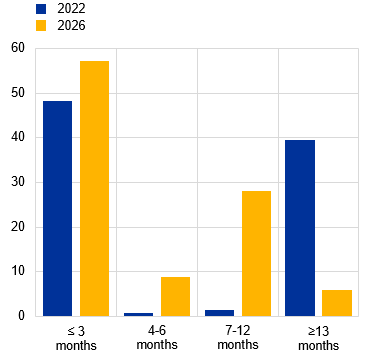
The pass-through of wholesale prices to retail prices has sped up for gas prices overall, but the broad pattern of lagged and uneven transmission remains for both gas prices and electricity prices (Chart F). In several euro area countries, electricity and gas retail markets have been increasingly liberalised. New contract types tend to shorten the duration of fixed-term contracts or introduce more flexible tariffs. These tariffs often have closer links to wholesale prices, which increases the frequency of retail price changes. A 2026 survey of Eurosystem national central banks found that changes in wholesale gas prices are expected to be passed on to HICP gas inflation within 1-3 months in more than half of the euro area, within 4-6 months in around one-tenth of the euro area and within 7-12 months in around one-third of the euro area – all higher than in 2022. Notably, the share of countries to report a slow pass-through within 13-24 months has decreased from around 40% to around 5% since 2022. The rate of pass-through for electricity prices is distributed more widely (between less than a month and up to two years) and is still estimated to be roughly the same as in 2022.
Chart F
Pass-through of changes in wholesale prices to HICP gas and electricity inflation in euro area countries
a) Gas |
b) Electricity |
|---|---|
(weighted share of countries) |
(weighted share of countries) |
 |
 |
Source: ECB.
Notes: Based on a survey of Eurosystem national central banks. Answers are weighted by the contribution of each country to euro area HICP gas and electricity inflation.
Several structural features have evolved since the 2021-22 energy price shock and changed the transmission of wholesale gas prices to consumer bills. The growing share of renewables in electricity generation has weakened the mechanical link between wholesale gas and wholesale electricity prices. The pass-through of changes in wholesale prices to HICP gas inflation has accelerated. Alongside improvements in HICP electricity and gas price indices that better represent consumer costs, these developments suggest that shifts in wholesale gas prices may feed through to HICP gas inflation somewhat more swiftly than in the past, but less intensely for HICP electricity inflation, with cross-country variation remaining in both cases. Energy supply and demand continue to be affected by the conflict in the Middle East but were also affected by the extreme weather events during the summer. This implies that wholesale energy price dynamics require close monitoring, as their pass-through to consumer prices remains an important source of near-term volatility in HICP inflation.
References
Demuth, L., Manu, A. and Stalla-Bourdillon, A. (2026), “Energy shock: why oil and gas prices have risen less than expected”, The ECB Blog, ECB, 27 July.
European Central Bank (2026), June 2026 Eurosystem staff macroeconomic projections for the euro area.
European Commission (2026), “EU energy markets: evolving gas-electricity price linkages in a more volatile system”, 2026 Spring Economic Forecast, 26 May.
Grynberg, C., Vinci, F. and De Sanctis, A. (2026), “Energy security and industrial competitiveness: the case for a European Energy Union”, Occasional Papers Series, No 388, ECB.
Kuik, F., Adolfsen, J.F., Lis, E.M. and Meyler, A. (2022), “Energy price developments in and out of the COVID-19 pandemic – from commodity prices to consumer prices”, Economic Bulletin, Issue 4, ECB.
Kuik, F., Lis, E., Nickel, C. and Porqueddu, M. (2026), “From well to pump: how fuel prices are formed”, The ECB Blog, ECB, 31 July.
Quintana, J. (2024), “The impact of renewable energies on wholesale electricity prices”, Economic Bulletin, Issue 2024/Q3, Banco de España, 4 September.
Legal Disclaimer:
EIN Presswire provides this news content "as is" without warranty of any kind. We do not accept any responsibility or liability for the accuracy, content, images, videos, licenses, completeness, legality, or reliability of the information contained in this article. If you have any complaints or copyright issues related to this article, kindly contact the author above.
